TAMPA, Fla. –
Overseas Shipholding Group, Inc. (NYSE:OSG) (the “Company” or “OSG”) a
provider of energy transportation services for crude oil and petroleum
products in the U.S. Flag markets, today reported results for the first
quarter 2019.
Highlights
-
Net income for the first quarter 2019 was $3.2 million, or $0.04 per
diluted share, compared with net income of $3.7 million, or $0.04 per
diluted share, for the first quarter 2018. The Company’s 2019 first
quarter net income of $3.2 million compares to a $5.2 million loss in
the 2018 fourth quarter. -
Shipping revenues for the first quarter 2019 were $87.7 million, down
13.2% compared with the same period in 2018. Time charter equivalent
(TCE) revenues(A), a non-GAAP measure, for the first
quarter 2019 were $82.8 million, down 6.8% compared with the first
quarter 2018. First quarter 2019 TCE revenues exceeded fourth quarter
2018 by 3.6%. -
First quarter 2019 Adjusted EBITDA(B), a non-GAAP measure,
was $23.6 million, down 15.5% from $28.0 million in the first quarter
2018. Adjusted EBITDA increased 2.2% from the fourth quarter 2018. - Total cash(C) was $75.8 million as of March 31, 2019.
-
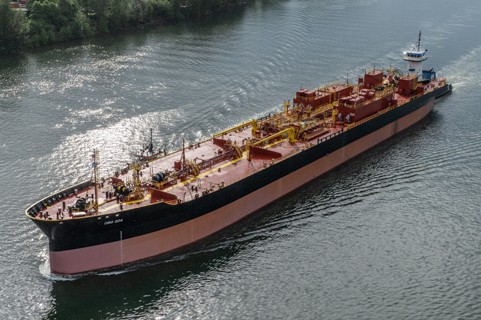
In January 2019, we entered into a 10-year bareboat charter party
agreement for a U.S. flagged product tanker and we exercised an option
to construct a second approximately 204,000 BBL, oil and chemical tank
barge for anticipated delivery to the Company during the second half
of 2020.
Mr. Sam Norton, President and CEO, stated, “Our first quarter financial
performance is evidence of the developing recovery of OSG’s earnings
power, as improved charter terms for our conventional tanker fleet
counterbalanced the retirement of aging tonnage as part of our ongoing
fleet renewal efforts. Time charter contracts fixed during the second
half of 2018, coupled with active interest in the few spot days
available, led utilization rates for the combined conventional tanker
and ATB fleet to exceed 95% of available operating days during the
quarter. In line with tightening supply availability, we are seeing the
benefits of both an improved rate environment and better utilization
rates. In particular, conventional tanker TCE earnings have improved 5%
from the 4th quarter of 2018 and more than 25% from their 3rd quarter
levels. Meanwhile, our niche businesses continued to perform in-line
with our expectations, providing a solid foundation of industrial
business that underlies our growth and margin expansion initiatives.”
Mr. Norton added, “We are confident in the strong, tangible fundamentals
underlying the Jones Act and U.S. Flag energy transportation markets in
which we operate. We anticipate that the full effects of our high
operating leverage will be more fully expressed in the latter part of
2019 and into 2020, alongside the additional earnings contribution we
expect from our newly built ATBs and MR tankers delivering over the next
18 months. All in all, we remain extremely upbeat about the future and
the promise of improving earnings in our core businesses.”
First Quarter 2019 Results
Shipping revenues were $87.7 million for the quarter, down 13.2%
compared with the first quarter of 2018. TCE revenues for the first
quarter of 2019 were $82.8 million, a decrease of $6.0 million, or 6.8%,
compared with the first quarter of 2018. This decrease reflected two
fewer vessels in operation in the first quarter of 2019 when compared to
the 2018 first quarter and a decrease in spot market charters as our
fleet moved to long-term time charters.
|
A, B, C |
|
Reconciliations of these non-GAAP financial measures are |
Operating income for the first quarter of 2019 was $9.7 million,
compared to operating income of $13.6 million in the first quarter of
2018.
Net income for the first quarter 2019 was $3.2 million, or $0.04 per
diluted share, compared with net income of $3.7 million, or $0.04 per
diluted share, for the first quarter 2018.
Adjusted EBITDA was $23.6 million for the first quarter, a decrease of
$4.4 million compared with the first quarter of 2018, driven primarily
by the decline in TCE revenues.
Conference Call
The Company will host a conference call to discuss its 2019 first
quarter results at 11:00 a.m. Eastern Time (“ET”) on Thursday, May 9,
2019.
To access the call, participants should dial (844) 850-0546 for domestic
callers and (412) 317-5203 for international callers. Please dial in ten
minutes prior to the start of the call.
A live webcast of the conference call will be available from the
Investor Relations section of the Company’s website at http://www.osg.com/.
An audio replay of the conference call will be available starting at
1:00 p.m. ET on Thursday, May 9, 2019, by dialing (877) 344-7529 for
domestic callers and (412) 317-0088 for international callers and
entering Access Code 10131358.
About Overseas Shipholding Group, Inc.
Overseas Shipholding Group, Inc. (NYSE:OSG) is a publicly traded tanker
company providing energy transportation services for crude oil and
petroleum products in the U.S. Flag markets. OSG is a major operator of
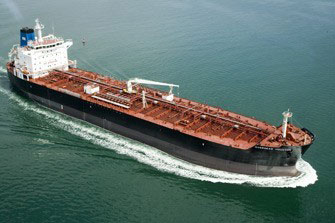
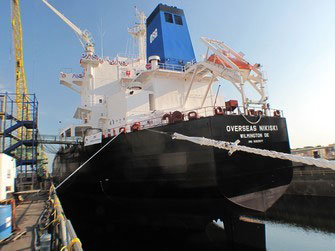
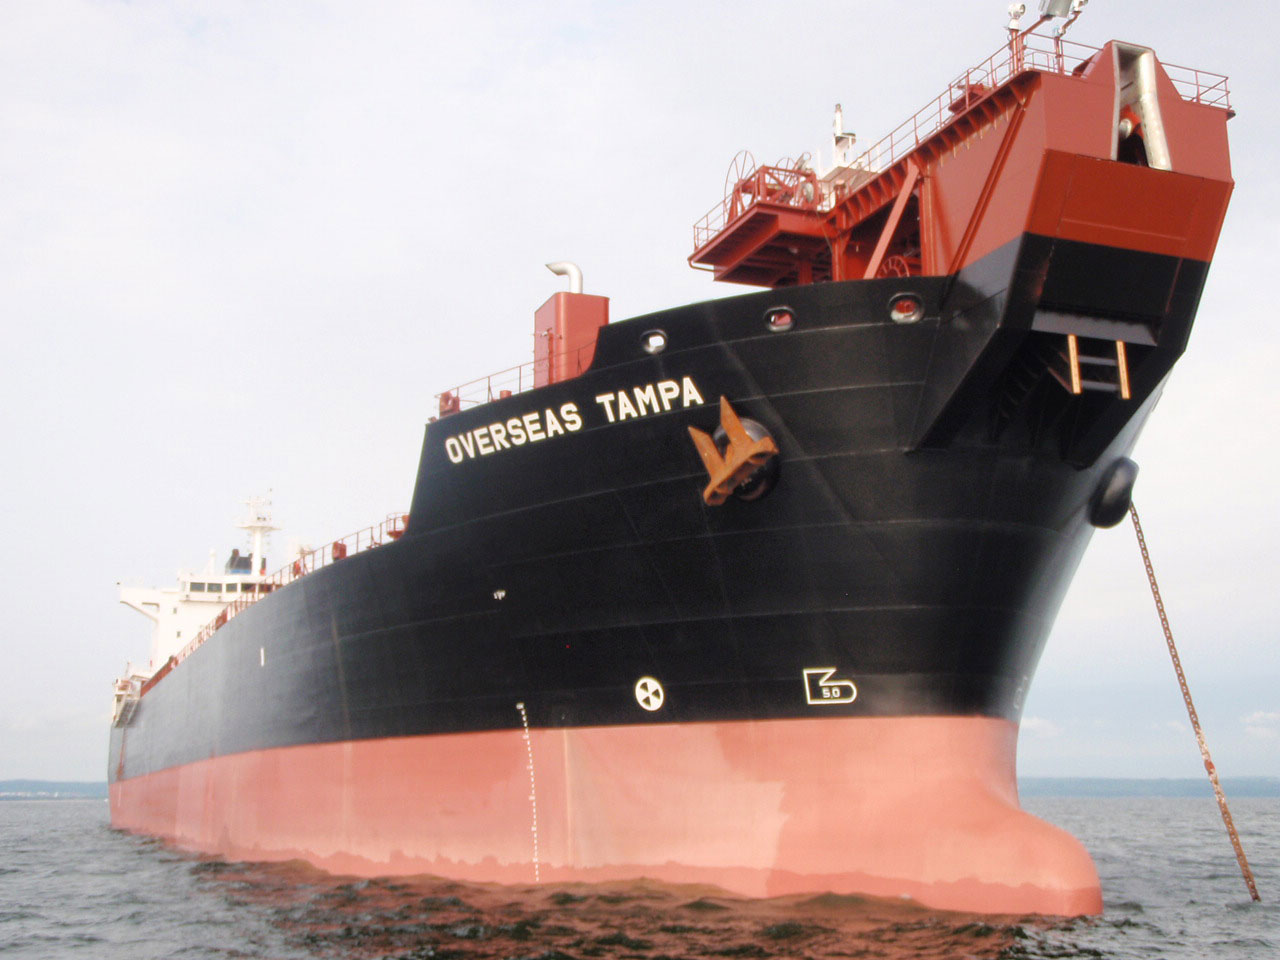
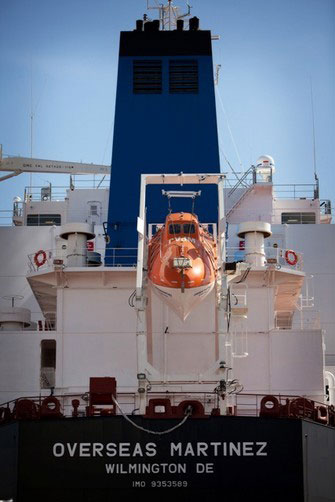
tankers and ATBs in the Jones Act industry. OSG’s 21-vessel U.S. Flag
fleet consists of five ATBs, two lightering ATBs, three shuttle tankers,
nine MR tankers, and two non-Jones Act MR tankers that participate in
the U.S. MSP. OSG is committed to setting high standards of excellence
for its quality, safety and environmental programs. OSG is recognized as
one of the world’s most customer-focused marine transportation companies
and is headquartered in Tampa, FL. More information is available at www.osg.com.
Forward-Looking Statements
This release contains forward-looking statements. In addition, the
Company may make or approve certain statements in future filings with
the Securities and Exchange Commission (SEC), in press releases, or in
oral or written presentations by representatives of the Company. All
statements other than statements of historical facts should be
considered forward-looking statements. These matters or statements may
relate to the Company’s prospects, its ability to retain and effectively
integrate new members of management, the delivery timelines for the
Company’s new vessels, and the performance of the Company’s niche and
core businesses. Forward-looking statements are based the Company’s
current plans, estimates and projections, and are subject to change
based on a number of factors. Investors should carefully consider the
risk factors outlined in more detail in the Annual Report on Form 10-K
for OSG and in similar sections of other filings made by the Company
with the SEC from time to time. The Company assumes no obligation to
update or revise any forward-looking statements. Forward-looking
statements and written and oral forward-looking statements attributable
to the Company or its representatives after the date of this release are
qualified in their entirety by the cautionary statements contained in
this paragraph and in other reports previously or hereafter filed by the
Company with the SEC.
|
Consolidated Statements of Operations |
||||||||
|
($ in thousands, except per share amounts) |
||||||||
| Three Months Ended | ||||||||
| March 31, | ||||||||
| 2019 | 2018 | |||||||
| Shipping Revenues: | ||||||||
| Time and bareboat charter revenues | $ | 63,120 | $ | 53,895 | ||||
| Voyage charter revenues | 24,617 | 47,135 | ||||||
| 87,737 | 101,030 | |||||||
| Operating Expenses: | ||||||||
| Voyage expenses | 4,984 | 12,252 | ||||||
| Vessel expenses | 32,446 | 33,505 | ||||||
| Charter hire expenses | 22,298 | 22,547 | ||||||
| Depreciation and amortization | 12,478 | 12,372 | ||||||
| General and administrative | 5,674 | 6,783 | ||||||
| Loss on disposal of vessels and other property, including impairments | 117 | – | ||||||
| Total operating expenses | 77,997 | 87,459 | ||||||
| Operating income | 9,740 | 13,571 | ||||||
| Other income/(expense) | 355 | (631 | ) | |||||
| Income before interest expense, reorganization items and income taxes | 10,095 | 12,940 | ||||||
| Interest expense | (6,506 | ) | (8,076 | ) | ||||
| Income before income taxes | 3,589 | 4,864 | ||||||
| Income tax provision | (392 | ) | (1,202 | ) | ||||
| Net income | $ | 3,197 | $ | 3,662 | ||||
| Weighted Average Number of Common Shares Outstanding: | ||||||||
| Basic – Class A | 89,004,947 | 88,105,439 | ||||||
| Diluted – Class A | 89,421,143 | 88,620,596 | ||||||
| Per Share Amounts: | ||||||||
| Basic and diluted net income – Class A | $ | 0.04 | $ | 0.04 | ||||
|
Consolidated Balance Sheets |
||||||||
|
($ in thousands) |
||||||||
| March 31, | December 31, | |||||||
| 2019 | 2018 | |||||||
| (unaudited) | ||||||||
| ASSETS | ||||||||
| Current Assets: | ||||||||
| Cash and cash equivalents | $ | 75,602 | $ | 80,417 | ||||
| Restricted cash | 59 | 59 | ||||||
| Voyage receivables, including unbilled of $8,400 and $10,160 | 26,799 | 16,096 | ||||||
| Income tax receivable | 505 | 439 | ||||||
| Other receivables | 1,452 | 3,027 | ||||||
| Prepaid expenses | 1,751 | 9,886 | ||||||
| Inventories and other current assets | 2,465 | 2,456 | ||||||
| Total Current Assets | 108,633 | 112,380 | ||||||
| Vessels and other property, less accumulated depreciation | 598,407 | 597,659 | ||||||
| Deferred drydock expenditures, net | 24,105 | 26,099 | ||||||
| Total Vessels, Other Property and Deferred Drydock | 622,512 | 623,758 | ||||||
| Restricted cash – noncurrent | 140 | 165 | ||||||
| Investments in and advances to affiliated companies | 38 | 3,585 | ||||||
| Intangible assets, less accumulated amortization | 35,267 | 36,417 | ||||||
| Operating lease right-of-use assets | 247,262 | – | ||||||
| Other assets | 50,411 | 51,425 | ||||||
| Total Assets | $ | 1,064,263 | $ | 827,730 | ||||
| LIABILITIES AND EQUITY | ||||||||
| Current Liabilities: | ||||||||
| Accounts payable, accrued expenses and other current liabilities | $ | 30,571 | $ | 34,678 | ||||
| Current portion of operating lease liabilities | 81,897 | – | ||||||
| Current installments of long-term debt | 26,306 | 23,240 | ||||||
| Total Current Liabilities | 138,774 | 57,918 | ||||||
| Reserve for uncertain tax positions | 218 | 220 | ||||||
| Noncurrent operating lease liabilities | 181,211 | – | ||||||
| Long-term debt | 315,211 | 322,295 | ||||||
| Deferred income taxes, net | 73,373 | 73,365 | ||||||
| Other liabilities | 21,463 | 44,464 | ||||||
| Total Liabilities | 730,250 | 498,262 | ||||||
| Equity: | ||||||||
|
Common stock – Class A ($0.01 par value; 166,666,666 shares authorized; 85,292,751 and 84,834,790 shares issued and outstanding) |
853 | 848 | ||||||
| Paid-in additional capital | 589,086 | 587,826 | ||||||
| Accumulated deficit | (248,817 | ) | (252,014 | ) | ||||
| 341,122 | 336,660 | |||||||
| Accumulated other comprehensive loss | (7,109 | ) | (7,192 | ) | ||||
| Total Equity | 334,013 | 329,468 | ||||||
| Total Liabilities and Equity | $ | 1,064,263 | $ | 827,730 | ||||
|
Consolidated Statements of Cash Flows |
||||||||
|
($ in thousands) |
||||||||
| Three Months Ended | ||||||||
| March 31, | ||||||||
| 2019 | 2018 | |||||||
| Cash Flows from Operating Activities: | ||||||||
| Net income | $ | 3,197 | $ | 3,662 | ||||
| Items included in net income not affecting cash flows: | ||||||||
| Depreciation and amortization | 12,478 | 12,372 | ||||||
| Loss on disposal of vessels and other property, including impairments | 117 | – | ||||||
| Amortization of debt discount and other deferred financing costs | 510 | 1,106 | ||||||
|
Compensation relating to restricted stock awards and stock option grants |
309 | 793 | ||||||
| Deferred income tax provision | 111 | 1,492 | ||||||
| Other – net | 231 | 645 | ||||||
| Distributed earnings of affiliated companies | 3,548 | 3,747 | ||||||
| Payments for drydocking | (1,342 | ) | (2,037 | ) | ||||
| Changes in operating assets and liabilities | (8,040 | ) | (1,789 | ) | ||||
| Loss on extinguishment of debt, net | – | 981 | ||||||
| Net cash provided by operating activities | 11,119 | 20,972 | ||||||
| Cash Flows from Investing Activities: | ||||||||
| Expenditures for vessels and vessel improvements | (10,955 | ) | – | |||||
| Expenditures for other property | (588 | ) | – | |||||
| Net cash used in investing activities | (11,498 | ) | – | |||||
| Cash Flows from Financing Activities: | ||||||||
| Payments on debt | (4,167 | ) | (28,166 | ) | ||||
| Extinguishment of debt | – | (47,000 | ) | |||||
| Tax withholding on share-based awards | (294 | ) | (359 | ) | ||||
| Net cash used in financing activities | (4,461 | ) | (75,525 | ) | ||||
| Net decrease in cash, cash equivalents and restricted cash | (4,840 | ) | (54,553 | ) | ||||
| Cash, cash equivalents and restricted cash at beginning of period | 80,641 | 166,269 | ||||||
| Cash, cash equivalents and restricted cash at end of period | $ | 75,801 | $ | 111,716 | ||||
Spot and Fixed TCE Rates Achieved and Revenue Days
The following tables provides a breakdown of TCE rates achieved for spot
and fixed charters and the related revenue days for the three months
ended March 31, 2019, and the comparable period of 2018. Revenue days in
the quarter ended March 31, 2019, totaled 1,784 compared with 1,932 in
the prior year quarter. A summary fleet list by vessel class can be
found later in this press release.
| 2019 | 2018 | |||||||||||
| Spot | Fixed | Spot | Fixed | |||||||||
| Three Months Ended March 31, 2019 | Earnings | Earnings | Earnings | Earnings | ||||||||
| Jones Act Handysize Product Carriers: | ||||||||||||
| Average rate | $ | 27,940 | $ | 56,863 | $ | 41,227 | $ | 64,947 | ||||
| Revenue days | 90 | 982 | 337 | 720 | ||||||||
| Non-Jones Act Handysize Product Carriers: | ||||||||||||
| Average rate | $ | 25,898 | $ | 12,097 | $ | 35,900 | $ | 62,542 | ||||
| Revenue days | 113 | 67 | 172 | 8 | ||||||||
| ATBs: | ||||||||||||
| Average rate | $ | 20,992 | $ | 21,557 | $ | 12,230 | $ | 22,979 | ||||
| Revenue days | 86 | 266 | 261 | 261 | ||||||||
| Lightering: | ||||||||||||
| Average rate | $ | 72,905 | $ | – | $ | 70,925 | $ | – | ||||
| Revenue days | 180 | – | 173 | – | ||||||||
Fleet Information
As of March 31, 2019, OSG’s operating fleet consisted of 21 vessels, 11
of which were owned, with the remaining vessels chartered-in. Vessels
chartered-in are on Bareboat Charters.
| Vessels | Vessels | Total | |||||
| Vessel Type | Owned | Chartered-In | Vessels | Total dwt (2) | |||
| Handysize Product Carriers (1) | 4 | 10 | 14 | 664,490 | |||
| Refined Product ATBs | 5 | – | 5 | 141,612 | |||
| Lightering ATBs | 2 | – | 2 | 91,112 | |||
| Total Operating Fleet | 11 | 10 | 21 | 897,214 |
(1) Includes two owned shuttle tankers, one chartered-in shuttle tanker
and two owned U.S. Flag Product Carriers that trade internationally.
(2) Total dwt is defined as aggregate deadweight tons for all vessels of
that type.
Reconciliation to Non-GAAP Financial Information
The Company believes that, in addition to conventional measures prepared
in accordance with GAAP, the following non-GAAP measures may provide
certain investors with additional information that will better enable
them to evaluate the Company’s performance. Accordingly, these non-GAAP
measures are intended to provide supplemental information, and should
not be considered in isolation or as a substitute for measures of
performance prepared with GAAP.
(A) Time Charter Equivalent (TCE) Revenues
Consistent with general practice in the shipping industry, the Company
uses TCE revenues, which represents shipping revenues less voyage
expenses, as a measure to compare revenue generated from a voyage
charter to revenue generated from a time charter. Time charter
equivalent revenues, a non-GAAP measure, provides additional meaningful
information in conjunction with shipping revenues, the most directly
comparable GAAP measure, because it assists Company management in making
decisions regarding the deployment and use of its vessels and in
evaluating their financial performance. Reconciliation of TCE revenues
of the segments to shipping revenues as reported in the consolidated
statements of operations follow:
| Three Months Ended | ||||||
| March 31, | ||||||
| 2019 | 2018 | |||||
| Time charter equivalent revenues | $ | 82,753 | $ | 88,778 | ||
| Add: Voyage expenses | 4,984 | 12,252 | ||||
| Shipping revenues | $ | 87,737 | $ | 101,030 | ||
Vessel Operating Contribution
Vessel operating contribution, a non-GAAP measure, is TCE revenues minus
vessel expenses and charter hire expenses.
Our “niche market activities,” which includes Delaware Bay lightering,
MSP vessels and shuttle tankers, continue to provide a stable operating
platform underlying our total US Flag operations. These vessels’
operations are insulated from the forces affecting the broader Jones Act
market.
The following table sets forth the contribution of our vessels:
| Three Months Ended | ||||||
| March 31, | ||||||
| ($ in thousands) | 2019 | 2018 | ||||
| Niche Market Activities | $ | 22,602 | $ | 27,908 | ||
| Jones Act Handysize Tankers | 2,439 | 2,309 | ||||
| ATBs | 2,968 | 2,509 | ||||
| Vessel Operating Contribution | 28,009 | 32,726 | ||||
| Depreciation and amortization | 12,478 | 12,372 | ||||
| General and administrative | 5,674 | 6,783 | ||||
| Loss on disposal of vessels and other property, including impairments | 117 | – | ||||
| Operating income | $ | 9,740 | $ | 13,571 | ||
(B) EBITDA and Adjusted EBITDA
EBITDA represents net (loss)/income from continuing operations before
interest expense, income taxes and depreciation and amortization
expense. Adjusted EBITDA consists of EBITDA adjusted to exclude
amortization classified in charter hire expenses, interest expense
classified in charter hire expenses, gain/(loss) on disposal of vessels
and other property, including impairments, loss on repurchases and
extinguishment of debt, non-cash stock based compensation expense and
the impact of other items that we do not consider indicative of our
ongoing operating performance. EBITDA and Adjusted EBITDA do not
represent, and should not be a substitute for, net (loss)/income or cash
flows from operations as determined in accordance with GAAP. Some of the
limitations are: (i) EBITDA and Adjusted EBITDA do not reflect our cash
expenditures, or future requirements for capital expenditures or
contractual commitments; (ii) EBITDA and Adjusted EBITDA do not reflect
changes in, or cash requirements for, our working capital needs; and
(iii) EBITDA and Adjusted EBITDA do not reflect the significant interest
expense, or the cash requirements necessary to service interest or
principal payments, on our debt. While EBITDA and Adjusted EBITDA are
frequently used as a measure of operating results and performance,
neither of them is necessarily comparable to other similarly titled
captions of other companies due to differences in methods of
calculation. The following table reconciles net income/(loss) from
continuing operations as reflected in the consolidated statements of
operations, to EBITDA and Adjusted EBITDA. Prior periods have been
adjusted to conform to current year presentation.
| Three Months Ended | ||||||
| March 31, | ||||||
| ($ in thousands) | 2019 | 2018 | ||||
| Net income | $ | 3,197 | $ | 3,662 | ||
| Income tax provision | 392 | 1,202 | ||||
| Interest expense | 6,506 | 8,076 | ||||
| Depreciation and amortization | 12,478 | 12,372 | ||||
| EBITDA | 22,573 | 25,312 | ||||
| Amortization classified in charter hire expenses | 231 | 465 | ||||
| Interest expense classified in charter hire expenses | 404 | 433 | ||||
| Non-cash stock based compensation expense | 309 | 793 | ||||
| Loss on disposal of vessels and other property, including impairments | 117 | – | ||||
| Loss on extinguishment of debt, net | – | 981 | ||||
| Adjusted EBITDA | $ | 23,634 | $ | 27,984 | ||
|
(C) Total Cash |
||||||
| March 31, | December 31, | |||||
| ($ in thousands) | 2019 | 2018 | ||||
| Cash and cash equivalents | $ | 75,602 | $ | 80,417 | ||
| Restricted cash – current | 59 | 59 | ||||
| Restricted cash – non-current | 140 | 165 | ||||
| Total Cash | $ | 75,801 | $ | 80,641 | ||
View source version on businesswire.com: https://www.businesswire.com/news/home/20190509005379/en/
Susan Allan, Overseas Shipholding Group, Inc.
(813) 209-0620
sallan@osg.com

