TAMPA, Fla. –
Overseas Shipholding Group, Inc. (NYSE: OSG) (the “Company” or “OSG”) a
provider of energy transportation services for crude oil and petroleum
products in the U.S. Flag markets, today reported results for the second
quarter 2017.
Highlights
-
Income from continuing operations for the second quarter was $3.2
million, or $0.04 per diluted share, compared to a net loss from
continuing operations of $4.2 million, or ($0.04) per diluted share,
for the second quarter 2016. -
Shipping revenues were $96.2 million for the current quarter, a
decrease of 18.7% from $118.4 million in the prior year quarter. Time
charter equivalent (TCE) revenues(A) for the second quarter
2017 were $91.1 million, down 20.6% compared to the same period in
2016. -
Net income was $3.2 million for the quarter ended June 30, 2017,
compared to $29.9 million for the quarter ended June 30, 2016. Net
income for the prior year period included income from discontinued
operations from International Seaways (INSW) of $34.0 million. -
Second quarter 2017 adjusted EBITDA(B) was $29.6 million,
down 35.6% from $46.0 million in the same period in 2016. -
Cash and cash equivalents were $204.6 million at June 30, 2017. Total
cash(C) was $210.5 million at the end of the current
quarter. -
During the second quarter 2017, we repurchased and retired $4.6
million in principal of the 8.125% notes due in 2018.
“Increasing exposure to weakening spot markets during the just completed
quarter weighed on top-line performance”, Sam Norton, OSG’s President
and CEO stated. “However, cost discipline helped to mitigate the effects
of these developments, and, together with earnings from our shuttle
tanker and lightering operations, served to produce healthy cash flows.
Progress continues strengthening our balance sheet and, with over $275
million of available liquidity, OSG remains favorably positioned to
respond to opportunities in our markets. ”
Second Quarter 2017 Results
Shipping revenues were $96.2 million for the quarter, down 18.7%
compared with the second quarter of 2016. The decrease in shipping
revenues was also driven by lower charter rates. TCE revenues for the
second quarter of 2017 were $91.1 million, a decrease of $23.7 million,
or 20.6%, compared with the second quarter of 2016, primarily due to
lower average daily rates earned. Shipping revenue for the first half of
2017 were $204.3 million, a decrease of $29.1 million compared to the
first half of 2016. TCE revenues for the first half of 2017 were $193.4
million, a decrease of $33.6 million compared to the first half of 2016.
Operating income for the second quarter of 2017 was $14.2 million,
compared to operating income of $23.0 million in the second quarter of
2016. The decrease reflected reduced operating expense, including
depreciation and amortization expense, and lower general and
administrative expenses, which partially offset the decline in shipping
revenues. Operating income for the first half of 2017 was $33.5 million,
a decrease of $6.9 million compared to the first half of 2016.
Income from continuing operations for the current period second quarter
was $3.2 million, or $0.04 per diluted share, compared with a loss from
continuing operations of $4.2 million, or ($0.04) per diluted share, for
the second quarter 2016. The increase reflects a lower tax provision in
the second quarter of 2017 compared to 2016. In the prior year period, a
deferred tax liability on the unremitted earnings of INSW was recorded,
resulting in an income tax provision of $15.1 million, compared to tax
expense of $1.6 million in the 2017 period. In addition, interest
expense decreased by $1.4 million in the current period as the result of
significant debt reductions in the current and prior year periods.
Income from continuing operations for the first half of 2017 was $8.6
million compared with a loss from continuing operations of $12.9 million
for the first half of 2016. The increase reflects a lower tax provision
in the first half of 2017 compared to 2016. In the prior period, a
deferred tax liability on the unremitted earnings of INSW was recorded,
resulting in an income tax provision of $48.3 million, compared to tax
expense of $5.2 million in the 2017 period.
Adjusted EBITDA(B), a non-GAAP measure, was $29.6 million for
the quarter, a decrease of $16.4 million or 35.6% compared with the
second quarter of 2016, driven primarily by the decline in TCE revenues,
partially offset by lower general and administrative expenses. Adjusted
EBITDA for the first half of 2017 was $65.7 million, a decrease of $21.0
million or 24.2% compared with the first half of 2016.
Discontinued Operations
As previously disclosed, OSG completed the separation of its business
into two independent publicly traded companies through the spin-off of
its then wholly owned subsidiary INSW on November 30, 2016. The spin-off
separated OSG and INSW into two distinct businesses with separate
management. OSG retained the U.S. Flag business and INSW holds entities
and other assets and liabilities that formed OSG’s former International
Flag business. The spin-off transaction was in the form of a pro rata
distribution of INSW’s common stock to our stockholders and warrant
holders of record as of the close of business on November 18, 2016.
In accordance with Accounting Standards Update (“ASU”) 2014-08, Reporting
Discontinued Operations and Disclosures of Disposals of Components of an
Entity, the assets and liabilities and results of operations of INSW
are reported as discontinued operations for the three and six months
ended June 30, 2016.
Net income from discontinued operations for the three and six months
ended June 30, 2016 was $34.0 million and $93.5 million, respectively.
Conference Call
The Company will host a conference call to discuss its second quarter
2017 results at 9:00 a.m. Eastern Time (“ET”) on Wednesday, August 9,
2017.
To access the call, participants should dial (844) 850-0546 for domestic
callers and (412) 317-5203 for international callers. Please dial in ten
minutes prior to the start of the call.
A live webcast of the conference call will be available from the
Investor Relations section of the Company’s website at http://www.osg.com/
An audio replay of the conference call will be available starting at
11:00 a.m. ET on Wednesday, August 9, 2017 by dialing (877) 344-7529 for
domestic callers and (412) 317-0088 for international callers, and
entering Access Code 10106141.
About Overseas Shipholding Group, Inc.
Overseas Shipholding Group, Inc. (NYSE:OSG) is a publicly traded tanker
company providing energy transportation services for crude oil and
petroleum products in the U.S. Flag markets. OSG is a major operator of
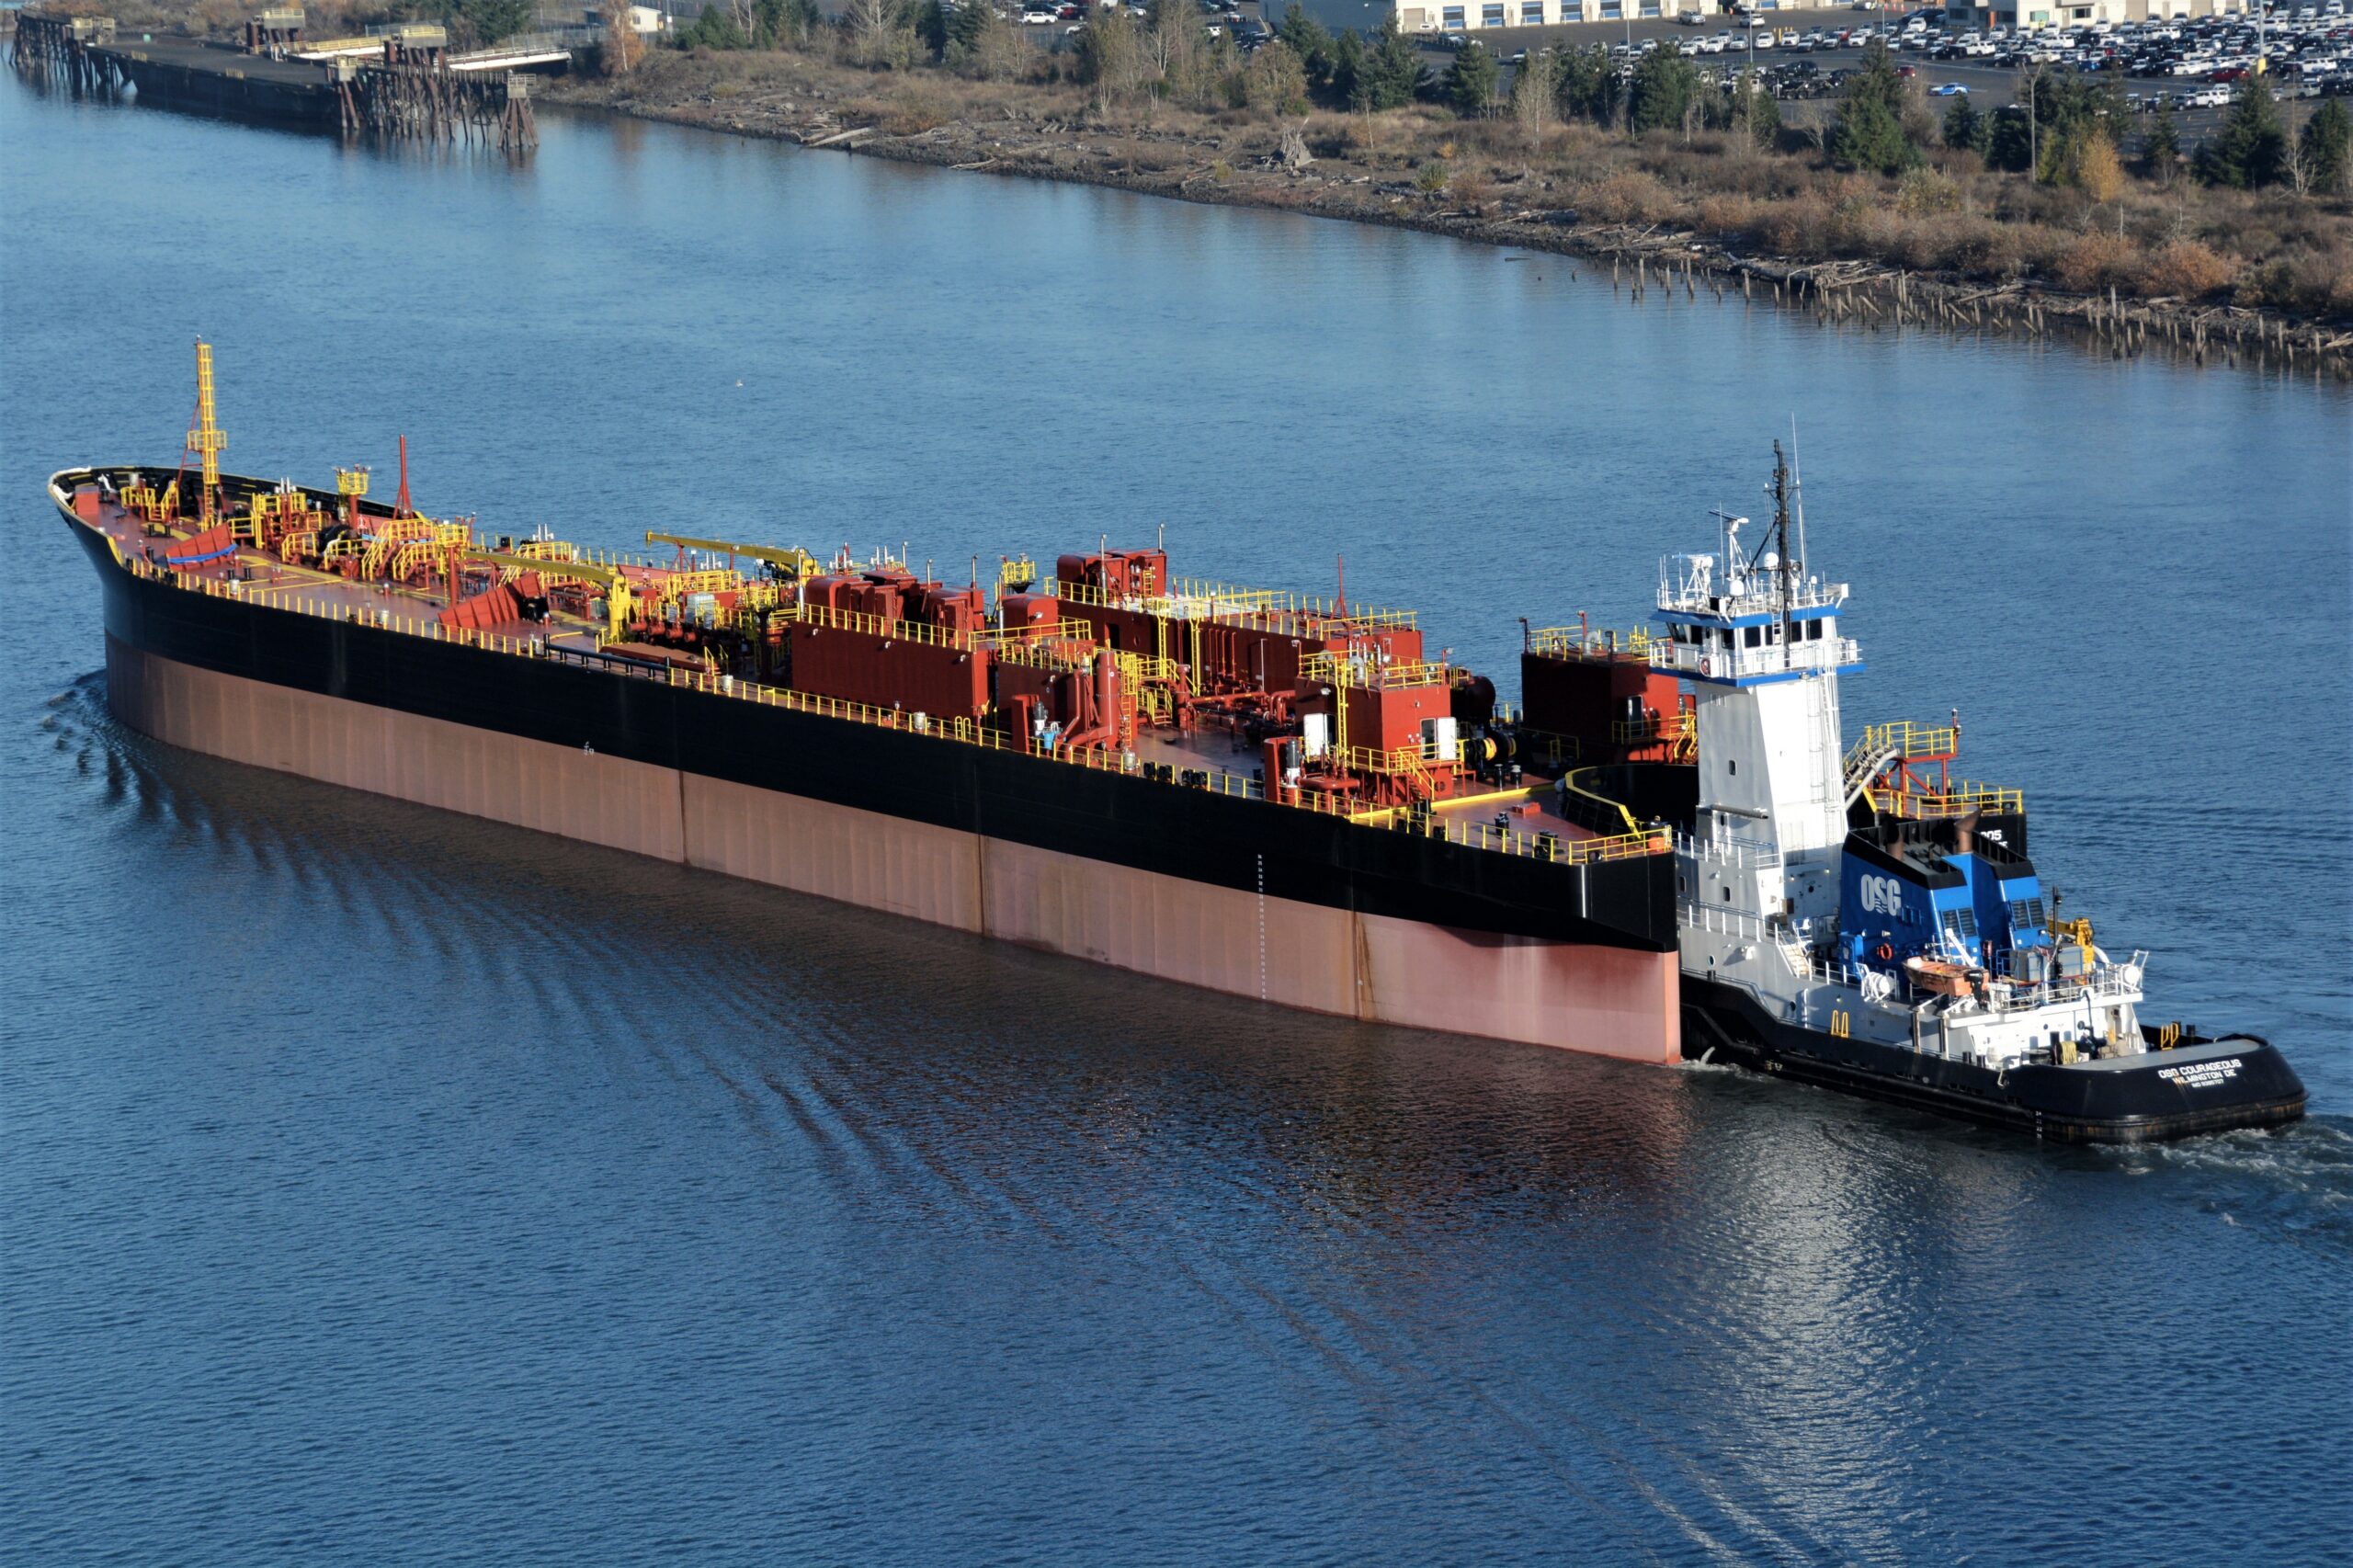
tankers and ATBs in the Jones Act industry. OSG’s 24-vessel U.S. Flag
fleet consists of eight ATBs, two lightering ATBs, three shuttle
tankers, nine MR tankers, and two non-Jones Act MR tankers that
participate in the U.S. MSP. OSG is committed to setting high standards
of excellence for its quality, safety and environmental programs. OSG is
recognized as one of the world’s most customer-focused marine
transportation companies and is headquartered in Tampa, FL. More
information is available at www.osg.com.
Forward-Looking Statements
This release contains forward-looking statements as defined under the
federal securities laws. Words such as “may”, “should”, “believes”,
“estimates”, “targets”, “anticipates” and similar expressions generally
identify forward-looking statements; however, statements other than
statements of historical facts should be considered forward-looking
statements. These matters or statements may relate to the Company’s
prospects, its ability to retain and effectively integrate new members
of management and the effect of the Company’s spin-off of International
Seaways, Inc. Forward-looking statements are based on the Company’s
current plans, estimates and projections, and are subject to change
based on a number of factors. The following factors, among others, could
cause the Company’s actual results to differ: the reduced
diversification and heightened exposure to the Jones Act market of OSG’s
business following the spin-off from OSG on November 30, 2016 of
International Seaways, Inc. (INSW), which owned or leased OSG’s fleet of
International Flag vessels, which may make OSG more susceptible to
market fluctuations than before such spin-off; the highly cyclical
nature of OSG’s industry; fluctuations in the market value of vessels;
declines in charter rates, including spot charter rates or other market
deterioration; an increase in the supply of vessels without a
commensurate increase in demand; the impact of adverse weather and
natural disasters; the adequacy of OSG’s insurance to cover its losses,
including in connection with maritime accidents or spill events;
constraints on capital availability; the Company’s ability to generate
sufficient cash to service its indebtedness and to comply with debt
covenants; the Company’s ability to renew its time charters when they
expire or to enter into new time charters; competition within the
Company’s industry and OSG’s ability to compete effectively for
charters; the loss of a large customer; and changes in demand in
specialized markets in which the Company currently trades. Investors
should also carefully consider the risk factors outlined in more detail
in the Annual Report on Form 10-K for OSG and in similar sections of
other filings made by the Company with the SEC from time to time. The
Company assumes no obligation to update or revise any forward-looking
statements. Forward-looking statements and written and oral forward
looking statements attributable to the Company or its representatives
after the date of this release are qualified in their entirety by the
cautionary statements contained in this paragraph and in other reports
previously or hereafter filed by the Company with the SEC.
A, B Reconciliations of these non-GAAP financial measures
are included in the financial tables attached to this press release
starting on Page 8.
C Reconciliation to total
cash is included in the financial tables attached to this press release
starting on Page 8.
|
Consolidated Statements of Operations |
||||||||||||||||||
|
($ in thousands, except per share amounts) |
||||||||||||||||||
| Three Months Ended | Six Months Ended | |||||||||||||||||
| June 30, | June 30, | |||||||||||||||||
| 2017 | 2016 | 2017 | 2016 | |||||||||||||||
| Shipping Revenues: | ||||||||||||||||||
| Time and bareboat charter revenues | $ | 72,116 | $ | 97,413 | $ | 151,883 | $ | 196,103 | ||||||||||
| Voyage charter revenues | 24,109 | 20,971 | 52,458 | 37,361 | ||||||||||||||
| 96,225 | 118,384 | 204,341 | 233,464 | |||||||||||||||
| Operating Expenses: | ||||||||||||||||||
| Voyage expenses | 5,149 | 3,643 | 10,941 | 6,510 | ||||||||||||||
| Vessel expenses | 32,564 | 34,610 | 68,173 | 70,514 | ||||||||||||||
| Charter hire expenses | 22,856 | 22,884 | 45,433 | 45,726 | ||||||||||||||
| Depreciation and amortization | 15,086 | 22,672 | 31,711 | 45,796 | ||||||||||||||
| General and administrative | 6,350 | 11,540 | 14,604 | 24,496 | ||||||||||||||
| Total Operating Expenses | 82,005 | 95,349 | 170,862 | 193,042 | ||||||||||||||
| Operating income | 14,220 | 23,035 | 33,479 | 40,422 | ||||||||||||||
| Other (expense)/income | 38 | (422 | ) | (630 | ) | 736 | ||||||||||||
| Income before interest expense, reorganization items and income taxes | 14,258 | 22,613 | 32,849 | 41,158 | ||||||||||||||
| Interest expense | (9,445 | ) | (10,862 | ) | (18,802 | ) | (22,779 | ) | ||||||||||
| Income before reorganization items and income taxes | 4,813 | 11,751 | 14,047 | 18,379 | ||||||||||||||
| Reorganization items, net | (9 | ) | (861 | ) | (244 | ) | 17,050 | |||||||||||
| Income from continuing operations before income taxes | 4,804 | 10,890 | 13,803 | 35,429 | ||||||||||||||
| Income tax provision from continuing operations | (1,593 | ) | (15,075 | ) | (5,162 | ) | (48,310 | ) | ||||||||||
| Income/(loss) from continuing operations | 3,211 | (4,185 | ) | 8,641 | (12,881 | ) | ||||||||||||
| Income from discontinued operations | – | 34,045 | – | 93,481 | ||||||||||||||
| Net income | $ | 3,211 | $ | 29,860 | $ | 8,641 | $ | 80,600 | ||||||||||
| Weighted Average Number of Common Shares Outstanding: | ||||||||||||||||||
| Basic – Class A | 87,769,483 | 92,255,692 | 88,309,231 | 93,496,651 | ||||||||||||||
| Diluted – Class A | 87,964,755 | 92,321,359 | 88,542,779 | 93,531,462 | ||||||||||||||
| Basic and Diluted – Class B | – | 826,794 | – | 1,073,382 | ||||||||||||||
| Per Share Amounts: | ||||||||||||||||||
|
Basic and diluted net income/(loss) – Class A from continuing operations |
$ | 0.04 | $ | (0.04 | ) | $ | 0.10 | $ | (0.13 | ) | ||||||||
| Basic and diluted net income – Class A from discontinued operations | $ | – | $ | 0.35 | $ | – | $ | 0.97 | ||||||||||
| Basic net income – Class A | $ | 0.04 | $ | 0.31 | $ | 0.10 | $ | 0.84 | ||||||||||
| Diluted net income – Class A | $ | 0.04 | 0.32 | $ | 0.10 | $ | 0.85 | |||||||||||
|
Basic and diluted net income/(loss) – Class B from continuing operations |
$ | – | $ | (0.27 | ) | $ | – | $ | (0.35 | ) | ||||||||
| Basic and diluted net income – Class B from discontinued operations | $ | – | $ | 2.19 | $ | – | $ | 2.56 | ||||||||||
| Basic and diluted net income – Class B | $ | – | $ | 1.92 | $ | – | $ | 2.21 | ||||||||||
| Cash dividends declared – Class A | $ | – | $ | – | $ | – | $ | 0.48 | ||||||||||
| Cash dividends declared – Class B | $ | – | $ | 1.08 | $ | – | $ | 1.56 | ||||||||||
|
Consolidated Balance Sheets |
||||||||||
|
($ in thousands) |
||||||||||
| June 30, | December 31, | |||||||||
| 2017 | 2016 | |||||||||
| (unaudited) | ||||||||||
| ASSETS | ||||||||||
| Current Assets: | ||||||||||
| Cash and cash equivalents | $ | 204,575 | $ | 191,089 | ||||||
| Restricted cash | 5,935 | 7,272 | ||||||||
| Voyage receivables, including unbilled of $5,887 and $12,593 | 20,819 | 23,456 | ||||||||
| Income tax receivable | 381 | 877 | ||||||||
| Receivable from INSW | 506 | 683 | ||||||||
| Other receivables | 17,745 | 2,696 | ||||||||
| Inventories, prepaid expenses and other current assets | 11,542 | 12,243 | ||||||||
| Total Current Assets | 261,503 | 238,316 | ||||||||
| Restricted cash – non-current | – | 8,572 | ||||||||
|
Vessels and other property, less accumulated depreciation of $233,241 and $213,173 |
664,411 | 684,468 | ||||||||
| Deferred drydock expenditures, net | 25,697 | 31,172 | ||||||||
| Total Vessels, Deferred Drydock and Other Property | 690,108 | 715,640 | ||||||||
| Investments in and advances to affiliated companies | 38 | 3,694 | ||||||||
|
Intangible assets, less accumulated amortization of $48,683 and $46,383 |
43,317 | 45,617 | ||||||||
| Other assets | 22,481 | 18,658 | ||||||||
| Total Assets | $ | 1,017,447 | $ | 1,030,497 | ||||||
| LIABILITIES AND EQUITY | ||||||||||
| Current Liabilities: | ||||||||||
| Accounts payable, accrued expenses and other current liabilities | $ | 44,029 | $ | 57,222 | ||||||
| Income taxes payable | 1,990 | 306 | ||||||||
| Current installments of long-term debt | 86,579 | – | ||||||||
| Total Current Liabilities | 132,598 | 57,528 | ||||||||
| Reserve for uncertain tax positions | 3,175 | 3,129 | ||||||||
| Long-term debt | 422,147 | 525,082 | ||||||||
| Deferred income taxes, net | 143,777 | 141,457 | ||||||||
| Other liabilities | 51,455 | 48,969 | ||||||||
| Total Liabilities | 753,152 | 776,165 | ||||||||
| Equity: | ||||||||||
| Common stock | 753 | 702 | ||||||||
| Paid-in additional capital | 584,112 | 583,526 | ||||||||
| Accumulated deficit | (313,095 | ) | (321,736 | ) | ||||||
| 271,770 | 262,492 | |||||||||
| Accumulated other comprehensive loss | (7,475 | ) | (8,160 | ) | ||||||
| Total Equity | 264,295 | 254,332 | ||||||||
| Total Liabilities and Equity | $ | 1,017,447 | $ | 1,030,497 | ||||||
|
Consolidated Statements of Cash Flows |
||||||||||
|
($ in thousands) |
||||||||||
| Six Months Ended | ||||||||||
| June 30, | ||||||||||
| 2017 | 2016 | |||||||||
| Cash Flows from Operating Activities: | ||||||||||
| Net income | $ | 8,641 | $ | 80,600 | ||||||
| Less: Net income from discontinued operations | – | 93,481 | ||||||||
| Net income/(loss) from continuing operations | 8,641 | (12,881 | ) | |||||||
|
Items included in net (loss)/income from continuing operations not affecting cash flows: |
||||||||||
| Depreciation and amortization | 31,711 | 45,796 | ||||||||
| Amortization of debt discount and other deferred financing costs | 2,653 | 3,190 | ||||||||
|
Compensation relating to restricted stock/stock unit and stock option grants |
1,699 | 1,804 | ||||||||
| Deferred income tax benefit | 2,121 | 45,666 | ||||||||
| Reorganization items, non-cash | 85 | 327 | ||||||||
| Discount on repurchase of debt | (925 | ) | (3,415 | ) | ||||||
| Other – net | 1,481 | 1,176 | ||||||||
| Distributions from INSW | – | 102,000 | ||||||||
| Distributed earnings of affiliated companies | 3,656 | 3,789 | ||||||||
| Payments for drydocking | (3,305 | ) | (4,588 | ) | ||||||
| SEC, Bankruptcy and IRS claim payments | (5,000 | ) | (7,136 | ) | ||||||
| Changes in operating assets and liabilities | (19,084 | ) | 7,349 | |||||||
| Net cash provided by operating activities | 23,733 | 183,077 | ||||||||
| Cash Flows from Investing Activities: | ||||||||||
| Change in restricted cash | 9,909 | 4,994 | ||||||||
| Expenditures for vessels and vessel improvements | – | (58 | ) | |||||||
| Expenditures for other property | (11 | ) | (265 | ) | ||||||
| Net cash provided by investing activities | 9,898 | 4,671 | ||||||||
| Cash Flows from Financing Activities: | ||||||||||
| Cash dividends paid | – | (31,910 | ) | |||||||
| Payments on debt | – | (43,879 | ) | |||||||
| Extinguishment of debt | (19,083 | ) | (52,667 | ) | ||||||
| Repurchases of common stock and common stock warrants | – | (76,388 | ) | |||||||
| Tax withholding on share-based awards | (1,062 | ) | – | |||||||
| Net cash used in financing activities | (20,145 | ) | (204,844 | ) | ||||||
|
Net increase/(decrease) in cash and cash equivalents from continuing operations |
13,486 | (17,096 | ) | |||||||
| Cash and cash equivalents at beginning of period | 191,089 | 193,978 | ||||||||
| Cash and cash equivalents at end of period | $ | 204,575 | $ | 176,882 | ||||||
|
Cash flows from discontinued operations: |
||||||||||
| Cash flows provided by operating activities | $ | – | $ | 122,764 | ||||||
| Cash flows used in investing activities | – | 26,464 | ||||||||
| Cash flows used in financing activities | – | (179,141 | ) | |||||||
|
Net decrease in cash and cash equivalents from discontinued operations |
$ | – | $ | (29,913 | ) | |||||
Spot and Fixed TCE Rates Achieved and Revenue Days
The following tables provide a breakdown of TCE rates achieved for spot
and fixed charters and the related revenue days for the three and six
months ended June 30, 2017 and 2016. Revenue days in the quarter ended
June 30, 2017 totaled 2,127 compared with 2,169 in the same quarter in
the prior year. A summary fleet list by vessel class can be found later
in this press release.
|
Three Months Ended June 30, |
2017 | 2016 | ||||||||||||||
| Spot | Fixed | Spot | Fixed | |||||||||||||
| Earnings | Earnings | Earnings | Earnings | |||||||||||||
|
Jones Act Handysize Product |
||||||||||||||||
| Average rate | $ | 18,288 | $ | 63,796 | $ | 26,483 | $ | 64,830 | ||||||||
| Revenue days | 173 | 900 | 24 | 1,057 | ||||||||||||
|
Non-Jones Act Handysize Product |
||||||||||||||||
| Average rate | $ | 28,169 | $ | 12,836 | $ | 30,492 | $ | 17,556 | ||||||||
| Revenue days | 91 | 91 | 125 | 57 | ||||||||||||
| ATBs: | ||||||||||||||||
| Average rate | $ | 7,234 | $ | 26,047 | $ | – | $ | 37,054 | ||||||||
| Revenue days | 202 | 488 | – | 724 | ||||||||||||
| Lightering: | ||||||||||||||||
| Average rate | $ | 69,183 | $ | – | $ | 76,555 | $ | – | ||||||||
| Revenue days | 182 | – | 182 | – | ||||||||||||
| TOTAL REVENUE DAYS | 648 | 1,479 | 331 | 1,838 | ||||||||||||
|
Six Months Ended June 30, |
2017 | 2016 | ||||||||||||||
| Spot | Fixed | Spot | Fixed | |||||||||||||
| Earnings | Earnings | Earnings | Earnings | |||||||||||||
| Jones Act Handysize Product Carriers: | ||||||||||||||||
| Average rate | $ | 26,361 | $ | 63,421 | $ | 26,483 | $ | 64,662 | ||||||||
| Revenue days | 245 | 1,889 | 24 | 2,136 | ||||||||||||
| Non-Jones Act Handysize Product Carriers: | ||||||||||||||||
| Average rate | $ | 30,353 | $ | 13,997 | $ | 30,924 | $ | 18,452 | ||||||||
| Revenue days | 203 | 159 | 216 | 148 | ||||||||||||
| ATBs: | ||||||||||||||||
| Average rate | $ | 11,856 | $ | 27,802 | $ | – | $ | 37,454 | ||||||||
| Revenue days | 382 | 1,012 | – | 1,420 | ||||||||||||
| Lightering: | ||||||||||||||||
| Average rate | $ | 72,137 | $ | – | $ | 69,795 | $ | – | ||||||||
| Revenue days | 362 | – | 364 | – | ||||||||||||
| TOTAL REVENUE DAYS | 1,192 | 3,060 | 604 | 3,704 | ||||||||||||
Fleet Information
As of June 30, 2017, OSG’s owned and operated fleet totaled 24 vessels
(14 vessels owned and 10 chartered-in) which remains unchanged since
December 31, 2016. Those figures include vessels in which the Company
has a partial ownership interest through its participation in joint
ventures.
| Vessels Owned | Vessels Chartered-in | Total at June 30, 2017 | |||||||||||||||
| Vessel Type | Number |
Weighted |
Number |
Weighted |
Total Vessels |
Vessels |
Total dwt (2)) | ||||||||||
| Handysize Product Carriers (1) | 4 | 4.0 | 10 | 10.0 | 14 | 14.0 | 664,490 | ||||||||||
| Refined Product ATBs | 8 | 8.0 | – | – | 8 | 8.0 | 226,064 | ||||||||||
| Lightering ATBs | 2 | 2.0 | – | – | 2 | 2.0 | 91,112 | ||||||||||
| Total Operating Fleet | 14 | 14.0 | 10 | 10.0 | 24 | 24.0 | 981,666 | ||||||||||
1 Includes two owned shuttle tankers, one chartered
in shuttle tanker and two owned U.S. Flag Product Carriers that trade
internationally. 2 Total Dwt is defined as the
total deadweight for all vessels of that type.
Reconciliation to Total Cash
(C) Total Cash
| ($ in thousands) |
June 30, 2017 |
December 31, 2016 |
||||
| Cash and cash equivalents |
$204,575 |
$ 191,089 | ||||
| Restricted cash | 5,935 | 15,844 | ||||
| Total Cash | $210,510 | $206,933 | ||||
Reconciliation to Non-GAAP Financial Information
The Company believes that, in addition to conventional measures prepared
in accordance with GAAP, the following non-GAAP measures may provide
certain investors with additional information that will better enable
them to evaluate the Company’s performance. Accordingly, these non-GAAP
measures are intended to provide supplemental information, and should
not be considered in isolation or as a substitute for measures of
performance prepared in accordance with GAAP.
(A) Time Charter Equivalent (TCE) Revenues
Consistent with general practice in the shipping industry, the Company
uses TCE revenues, which represents shipping revenues less voyage
expenses, as a measure to compare revenue generated from a voyage
charter to revenue generated from a long-term time charter. TCE, a
non-GAAP measure, provides additional meaningful information in
conjunction with shipping
revenues, the most directly comparable GAAP measure, because it assists
Company management in making decisions regarding the deployment and use
of its vessels and in evaluating their financial performance.
Reconciliation of TCE revenues of the segments to shipping revenues as
reported in the consolidated statements of operations follow:
| Three Months Ended | Six Months Ended | ||||||||||||||||
| June 30, | June 30, | ||||||||||||||||
| 2017 | 2016 | 2017 | 2016 | ||||||||||||||
| Time charter equivalent revenues | $ | 91,076 | $ | 114,741 | $ | 193,400 | $ | 226,954 | |||||||||
| Add: Voyage expenses | 5,149 | 3,643 | 10,941 | 6,510 | |||||||||||||
| Shipping revenues | $ | 96,225 | $ | 118,384 | $ | 204,341 | $ | 233,464 | |||||||||
(B) EBITDA and Adjusted EBITDA
EBITDA represents net income before interest expense, income taxes and
depreciation and amortization expense. Adjusted EBITDA consists of
EBITDA adjusted for the impact of certain items that we do not consider
indicative of our ongoing operating performance. EBITDA and Adjusted
EBITDA are presented to provide investors with meaningful additional
information that management uses to monitor ongoing operating results
and evaluate trends over comparative periods. EBITDA and Adjusted EBITDA
do not represent, and should not be a substitute for, net income or cash
flows from operations as determined in accordance with GAAP. Some of the
limitations are: (i) EBITDA and Adjusted EBITDA do not reflect our cash
expenditures, or future requirements for capital expenditures or
contractual commitments; (ii) EBITDA and Adjusted EBITDA do not reflect
changes in, or cash requirements for, our working capital needs; and
(iii) EBITDA and Adjusted EBITDA do not reflect the significant interest
expense, or the cash requirements necessary to service interest or
principal payments, on our debt. While EBITDA and Adjusted EBITDA are
frequently used as a measure of operating results and performance,
neither of them is necessarily comparable to other similarly titled
captions of other companies due to differences in methods of
calculation. The following table reconciles net income as reflected in
the consolidated statements of operations, to EBITDA and Adjusted EBITDA:
| Three Months Ended June 30, | Six Months Ended June 30, | |||||||||||||
| ($ in thousands) | 2017 | 2016 | 2017 | 2016 | ||||||||||
| Net income (loss) from continuing operations | $ | 3,211 | $ | (4,185) | $ | 8,641 | $ | (12,881) | ||||||
| Income tax provision | 1,593 | 15,075 | 5,162 | 48,310 | ||||||||||
| Interest expense | 9,445 | 10,862 | 18,802 | 22,779 | ||||||||||
| Depreciation and amortization | 15,086 | 22,672 | 31,711 | 45,796 | ||||||||||
| EBITDA | 29,335 | 44,424 | 64,316 | 104,004 | ||||||||||
| Loss on disposal of vessels, including impairments | – | 113 | – | 113 | ||||||||||
| Loss (gain) on repurchase of debt | 252 | 580 | 1,189 | (434) | ||||||||||
| Other costs associated with repurchase of debt | – | – | – | 77 | ||||||||||
| Reorganization items, net | 9 | 861 | 244 | (17,050) | ||||||||||
| Adjusted EBITDA | $ | 29,596 | $ | 45,978 | $ | 65,749 | $ | 86,710 | ||||||
View source version on businesswire.com: http://www.businesswire.com/news/home/20170809005356/en/
Investor Relations & Media:
Overseas Shipholding Group,
Inc.
Susan Allan, 813-209-0620
sallan@osg.com

